Comments
The images in this column were
generated using peaks with height of
1000 and 100.
For all images in this column the peaks
exhibit heights of 1000 or 800,
respectively.
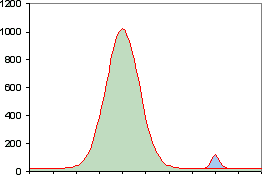
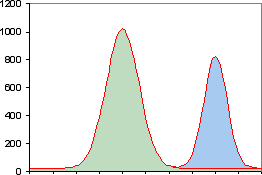
1. Two non-overlapping peaks
Here both peaks are clearly
separated. The peaks can be easily
detected by searching for local
maxima.
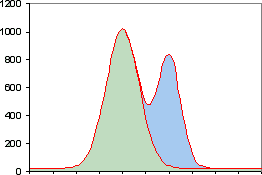
2. Two slightly overlapping peaks
Both peaks have a slight overlap.
The midpoint of the smaller peak is
located near the base point of the
larger peak.
A double peak will be visible in the
trace data.
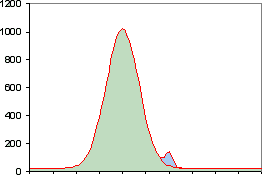
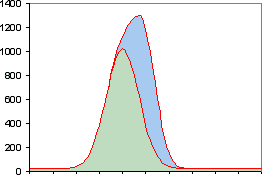
3. Flank overlap
The smaller peak has its mid point in
the middle of the flanking region of
the higher peak. If the smaller peak
is much more weaker than the
higher one, a shoulder is visible (left
image).
The right image shows a shoulder on
the left side of the stronger peak.
Please note: The location of the
weaker peak is exactly the same as
in the left image.
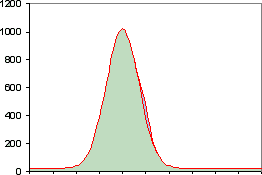
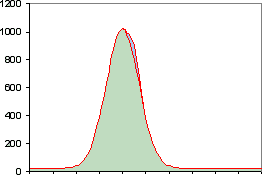
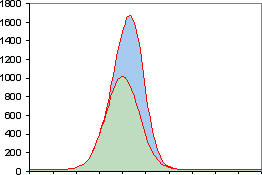
4. Near center overlap
If the peak maxima are close
together shoulders are hardly visible.
However, this also depends on the
height-to-width-ratio of the individual
peaks.