The speed and, thus, the temporal appearance of DNA fragments (electrophoresis peaks/bands),
i.e. their mobility, depends on many parameters and varies between different sample runs.
Table 1 lists some factors that influence the fragment mobility.
Tab. 1.
|
Parameter
|
Influence
|
|
Electrophoresis buffer
|
The older (depletion of ions) the slower the run.
|
|
Viscosity of the gel matrix
|
The lower the faster the run.
|
|
Voltage
|
The higher the faster the run.
|
|
Sample DNA concentration
|
The higher the faster the run.
|
Different electrophoresis parameters can cause a 500 base pair fragment to pass the detection
unit after 20 minutes in one case and after 25 minutes in a second case. This explains why the
same fragment has different data point values (time values) but identical base size labels.
Therefore, a size standard is run in an own color channel or gel lane in each run.
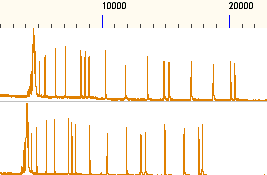
Figure 1 shows the same sample (here: a size standard) run under different electrophoresis
parameters. The data is scaled by data points, i.e. the curve points are drawn according to their
temporal appearance.
|
Fig. 1
The same size standard run under different
conditions. The pattern is very similar but in the
lower run, the sample peaks appear earlier and
in a shorter time interval. Therefore, the whole
sample appears 'compressed' if compared with
the upper one.
|
|
Also see