Description
Graphics
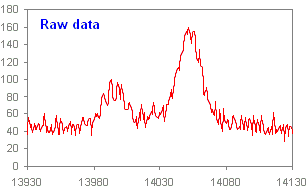
Raw data
The image to the right shows a
close up of raw trace data. Two
local maxima (peaks) are visible.
Note, that there are two problems:
The trace curve runs in a zigzag
manner and the peaks are sitting on
a background noise.
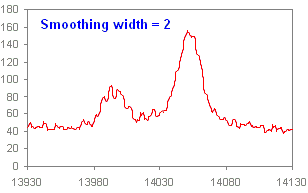
Smoothing width set to 2
Here a smoothing width value of 2
has been applied.
The zigzag Pattern is still clearly
visible. So the noise fluctuations are
not efficiently removed. The
smoothing width value is too low.
Too low!
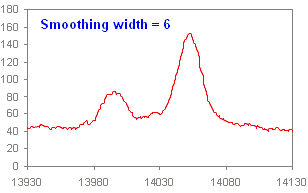
Smoothing width set to 6
With zigzag is weaker but still
present. This data could be used for
peak detection.
It would be better to adjust a little bit
greater smoothing width value.
Good!
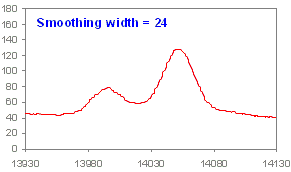
Smoothing width set to 24
The zigzag almost completely
vanished but the peaks remain
clearly visible. This seems to be the
best adjustment of the smoothing
width value.
Best!
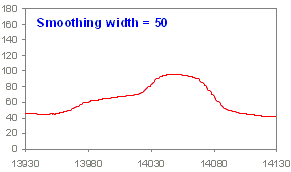
Smoothing width set to 50
Here the smoothing width value is
too great. The peaks are washed
away! So you will loose valuable
information.
Too high!
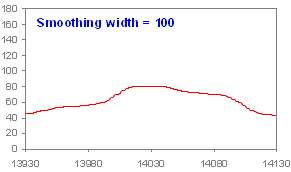
Smoothing width set to 100
The same as above: Smoothing
width value is too great. The peaks
are eliminated!
Much too high!