Description
Example
Fig 1. Raw data - the original data:
This image shows a close-up view of raw trace data
as acquired by an automatic sequencer.
Note:
There is a lot of noise in the data! The peaks are not
sitting on the bottom line.
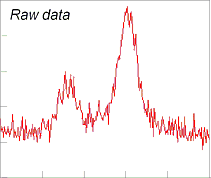
Fig2. Smoothing - the first processing step:
The example image shows the above raw data after
smoothing.
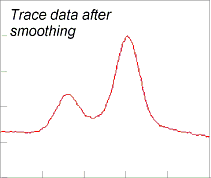
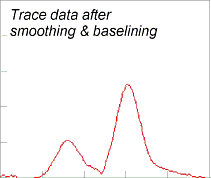
Fig 3. Baselining - the second processing step:
The image shows the same data set after correcting
the data using a baselining algorithm.